Wednesday, November 16, 2011

Traditional Computers on the Decline in 2011

IT Trends | Research

By David Nagel
04/14/11

Adoption of iPads and other alternative computing devices has started cutting into PC sales. Traditional computers--desktops, workstations, laptops, and netbooks--saw a steep decline in the first quarter of 2011 in the United States, with sluggish shipments worldwide as well, according to a new preliminary report released this week by market research firm Gartner.

More Than Just a Seasonal Weakness?
The report, "Preliminary PC Market Results, Worldwide, 1Q11," found that worldwide shipments of traditional PCs declined in the first three months of 2011 by 1.1 percent, bucking an earlier positive forecast of 3 percent growth for the quarter. And while the first quarter is typically a weak one for PC sales, the dip in 2011 may be more than just a seasonal blip.

"Weak demand for consumer PCs was the biggest inhibitor of growth," said Mikako Kitagawa, principal analyst at Gartner, in a statement released to coincide with the findings. "Low prices for consumer PCs, which had long stimulated growth, no longer attracted buyers. Instead, consumers turned their attention to media tablets and other consumer electronics. With the launch of the iPad 2 in February, more consumers either switched to buying an alternative device, or simply held back from buying PCs. We're investigating whether this trend is likely to have a long-term effect on the PC market."

Had it not been for stronger sales in professional markets, driven by ongoing replacement cycles, the worldwide slump would have been even deeper, according to the researchers.

Overall worldwide PC shipments were 84.25 million for the quarter compared with 85.18 million in the same period in 2010.


By comparison, for calendar year 2011, Gartner forecast worldwide tablet sales at 67.78 million--still a fraction of traditional PC sales, but an increasingly significant fraction. Overall volume of worldwide tablet purchases will grow substantially over the next five years, from just 17.61 million in 2010 to 294.09 million in 2015, as we reported earlier this week.

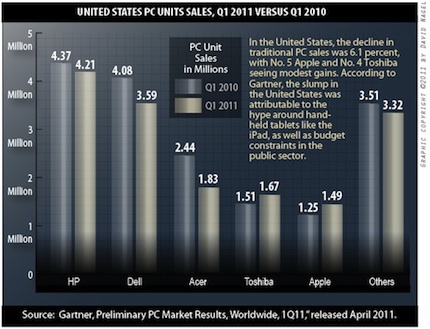
In the United States, the decline in traditional PC sales was much more drastic, with an overall 6.1 percent slip. According to Gartner, the slump in the United States was attributable to the hype around handheld tablets like the iPad, as well as budget constraints in the public sector.

"As with the worldwide market, the U.S. PC market was affected by the hype surrounding media tablets. This was the third consecutive quarter of mobile PC shipment declines in the U.S.," Kitagawa said. "The U.S. professional PC market showed steady growth across all sectors. However, the public sector showed more than the normal seasonal weakness due to budgetary issues."

Total shipments of desktops, workstations, laptops, and netbooks in the United States in the first quarter were off by more than a million--16.11 million in Q1 2011 compared with 17.16 million in Q1 2010.

Aside from Japan, which experienced major catastrophes late in the first quarter, the United States seemed to experience the worst decline in PC sales. Europe, the Middle East, and Africa (EMEA) declined 2.8 percent to 26.1 million units; Latin America increased 5.4 percent to 8.1 million units; and Asia/Pacific increased 4.1 percent to 28.2 million units shipped in the quarter. Japan's decline in the quarter was 13.1 percent to 4 million units.

Top Manufacturers Decline; Apple, Toshiba, Lenovo Rise
In the United States, Apple and Toshiba both saw positive growth. Apple cracked the top 5 with domestic unit sales of 1.49 million in the first quarter (not counting its iOS devices), up 18.9 percent over 2010 sales. The company ended the quarter with a 9.3 percent market share, up two points from Q1 2010.

No. 4 manufacturer Toshiba also saw double-digit growth domestically, with 1.67 million units, up 10.9 percent from Q1 2010's shipments. The company ended the quarter with a 10.4 percent market share, up 1.6 points from Q1 2010.

On the down side, No. 2 Dell and No. 3 Acer both slipped by double-digit percentages, while No. 1 HP slipped by single digits, managing to increase its overall market share in the process. Dell fell 12.1 percent in Q1 2011 with 3.59 million units sold in the United States, losing 1.5 points in market share and ending at 22.3 percent. Acer's sales fell 24.9 percent to 1.83 million units in the quarter, ending with an 11.3 percent market share, down from a 14.2 percent share in Q1 2010.

HP held on to the top slot in the United States and worldwide. In the United States, HP saw sales of 4.21 million units, a decline of 3.5 percent, while its market share rose a slight 0.7 points to 26.2 percent. However, HP's worldwide market share of 17.6 percent was off 0.4 points from the previous quarter on global unit shipments of 14.8 million, down 3.4 percent from Q1 2010.

Likewise, Acer and Dell declined on the worldwide PC scene. No. 2 Acer dropped 12.2 percent to 10.89 million units, ending with a 12.9 percent market share (compared with 14.6 in Q1 2010). No. 3 Dell's unit shipments fell a more modest 2.2 percent to 9.98 million. The company's market share was off just 0.1 points, ending at 11.9 percent.

The winners in global unit sales were No. 4 Lenovo and No. 5 Toshiba. (Apple didn't make the top 5 in global PC shipments.) Lenovo was up 16.6 percent with 8.14 million units and a 9.7 percent share of the market, up 1.5 points over Q1 2010. Toshiba climbed 5.3 percent to 4.82 million units in the quarter and a market share of 5.7 percent, up 0.3 points over Q1 2010.

The full report, "Preliminary PC Market Results, Worldwide, 1Q11," is available now. Details can be found here.


About the Author

David Nagel is the executive producer for 1105 Media's online K-12 and higher education publications and electronic newsletters. He can be reached at dnagel@1105media.com. He can now be followed on Twitter at http://twitter.com/THEJournalDave (K-12) or http://twitter.com/CampusTechDave (higher education).

SOURCE: http://campustechnology.com/Articles/2011/04/14/Traditional-Computers-on-the-Decline-in-2011.aspx?p=1

Not ready for IPV6


Most Enterprise Networks Not Ready for IPv6
By Leila Meyer
05/17/11

An informal online survey conducted by Ipswitch Inc.'s Network Management Division revealed that 88 percent of enterprise networks are not fully ready for the change to IPv6, and 66.1 percent are less than 20 percent ready.

The poll asked, "What percentage of your network infrastructure is IPv6 ready?" At the time of publishing, the results breakdown was:
66.1 percent of respondents were 0 percent to 20 percent ready;
9.6 percent were 20 percent to 40 percent ready;
6.5 percent were 40 percent to 60 percent ready;
5.8 percent were 60 percent to 80 percent ready; and
12 percent were 80 percent to 100 percent ready.

Campus Technology's own informal poll in the first quarter of 2011 showed that 47 percent of participants believed they would experience "major disruptions" as a result of the shift to IPv6. Forty percent indicated they are or will be "fully prepared" by the time they will be affected by the switchover. The remainder said some non-critical systems may not be prepared in time.

These statistics are noteworthy because the last remaining blocks of IPv4 addresses have all been allocated and will soon run out, necessitating the switch to IPv6 network addressing, which has a billion-trillion times more capacity than IPv4.

While many computers and other networked devices have been IPv6-ready for several years, most enterprises still have legacy IPv4 equipment that must be upgraded; or, alternatively, organizations must incorporate technology to bridge the communications gap between their IPv4 and IPv6 devices. Failure to do so could result in a loss of Internet connectivity or presence.

To help promote the switch to IPv6, the Internet Society is holding World IPv6 Day June 8, 2011, when Facebook, Google, and Yahoo will work with the Internet Society and major content delivery networks, Akamai and Limelight Networks to conduct the first global-scale trial of IPv6. For 24 hours, participants will enable IPv6 on their main services


he goal of the event is to encourage Internet service providers, hardware manufacturers, operating system vendors, and other Web companies to prepare for the transition. The test will also help participating companies identify problems so they can correct them before their IPv6 services finally go live.

Participants in IPv6 day said they believe that their networks are ready and estimated that only 0.05 percent of customers will experience problems connecting through IPv6 on World IPv6 Day owing to network equipment that is incorrectly configured or not operating properly.

Other Web site owners and network operators are welcome to participate in World IPv6 Day. More information is available here.

New Study Reveals Student Perspective on Technology Use in Higher Education

By Kanoe Namahoe
10/03/11

College students believe that technology has a direct impact on their academic performance, according to findings from a new student-driven study out of the Lone Star College System. In “The National Lone Star Report on Aligning Technology with Student Success,” 78 percent of college students reported that their grades and learning experience are improved when technology is effectively and consistently implemented on their campus.

The Report is a compilation of survey data collected from more than 6,000 students on 36 campuses across the country. Focused exclusively on two-year colleges, the study also included analysis of more than 1.5 million helpdesk inquiries from 55 institutions. The student-led initiative is the first of its kind, according to LSCS vice chancellor and CIO Shah Ardalan.

"'The National Lone Star Report on Aligning Technology with Student Success' will allow college administrators access to the collective voice of American students and it provides invaluable data on students' needs, desires and dreams, and how technology can help them achieve these goals," Ardalan said in a prepared statement.

Key findings in the report reflect students' desire for reliable, effective technology that is used consistently by instructors:
Colleges should not implement technology for the sake of technology;
When technology is deployed, make sure that it works; and
Faculty members need to know how to use the technology and they should actually use it.

While students believe technology is integral to their learning success, the report showed that they do not simply want more technology--they want the right technology. Students want systems and applications that serve their needs, support learning, and work properly "without getting in the way." Students expressed frustration with non-working technologies that waste time and money.

"Technology, when effectively used, strongly impact[s] my ability to learn," one respondent noted. "However, when it is not used properly or [is used] inefficiently it is very much a distraction and annoyance."

The National Lone Star Report was based on interviews and surveys from students at rural and metro-area community college campuses throughout the United States. The report will be produced annually and is available for free download to participating colleges. For additional information, visit lonestar.edu/nationalstudentreport.

About the Author

Kanoe Namahoe is the e-content producer for 1105 Media's Education Group. She can be reached at knamahoe@1105media.com.                     

The 2010 Campus Computing Survey

EDUCAUSE Conference Video 

IT Budget Cuts Slowing;Campus LMS Strategies in Transition

The budget cuts that have wrecked havoc on college and university IT units and resources in recent years may be abating: new data from institutions participating in the annual Campus Computing Survey reveal that two-fifths (41.6 percent) of colleges and universities reported a budget cut in central IT services for the current academic year, down from fully half (50.0 percent) in fall 2009. Private/non-profit institutions fared better than their public counterparts: the proportion of private universities reporting IT budget cuts fell by more than half, from 56.9 percent in 2009 to 24.4 percent in 2010. Among private four-year colleges, the percentage reporting budget cuts fell from 41.9 percent last year to 31.9 percent this fall.

Although the percentage of public four-year colleges and universities reporting budget cuts also declined compared to 2009, the number went up for community colleges. Almost half (46.2 percent) of the community colleges participating in the 2010 survey reported budget reductions affecting central IT services, compared to 38.0 percent in 2009. In contrast, fewer public universities suffered IT budget this year than last (59.8 percent in 2010 vs. 67.1 percent in 2009), as did fewer public four-year colleges (46.6 percent this fall compared to 62.8 percent in 2009).

“The new survey data provide a modicum of good news about money: fewer institutions experienced budget reductions this year than last,” says Kenneth C. Green, founding director of The Campus Computing Project, the largest continuing study of computing, eLearning, and information technology in American higher education. “But the on-going financial pressures confronting campus IT budgets continue to play havoc with the efforts of campus IT leaders to respond to the rising demand for IT resources and services, and the concurrent the need to invest in the campus IT infrastructure.” Green notes that the current round of budget reductions arrived just as campus IT units were just beginning to recover from the major budget cuts that came early in the decade. “No question that these budget cuts have affected instructional resources, and IT support services for students and faculty, and efforts to invest in the campus IT infrastructure.”

The 2010 survey data highlight the continuing transition in the higher education market for Learning Management Systems (LMS). The proportion of survey participants reporting that their institution uses Blackboard as the campus-standard LMS has dropped from to 71.0 percent in 2006 to 57.1 percent in 2010. Concurrently, Blackboard’s major LMS competitors have all gained share during this period. The percentage of campuses that use Desire2Learn as the campus-standard LMS is up five-fold, from 2.0 percent in 2006 to 10.1 percent in 2010. Moodle, an Open Source LMS, also registered big gains during this period, rising from 4.2 percent in 2006 to 16.4 percent in fall 2010 The numbers for Sakai, another Open Source LMS deployed primarily in research universities, have grown from 3.0 percent in 2006 to 4.6 percent in 2010.

“The LMS market is a textbook example of a mature market with immature, or evolving, technologies, and that’s a prescription for a volatile market,” says Green. “Blackboard’s announced plans to terminate support for its legacy LMS products have been a catalyst for many institutions to review the campus LMS strategy and to evaluate other LMS applications. This is now a competitive market and Blackboard’s major competitors are Desire2Learn, Moodle, and Sakai. All three have slowly but steadily gained attention, campus credibility, and market share in the past three years.”

Linked to the campus LMS strategy, more than two-thirds (70.3 percent) of the survey participants agree/strongly agree that “mobile [LMS] apps are an important part of our campus plan to enhance instructional resources and campus services.” However, the survey data indicate that mobile apps are in the early phase of campus deployment: as of fall 2010, a little more than an eighth (13.1 percent) of campuses have activated mobile apps; another tenth (10.1 percent) report that mobile apps are scheduled to go live at their institutions this current academic year (2010-11), while a quarter (24.8 percent) report that mobile apps are currently being reviewed by their institution.

"The campus interest in and movement to mobile apps reflects trends in the consumer market,” says Green. He cites data from Student Monitor’s spring 2010 survey of full-time undergraduates in four-year colleges indicating that 98 percent of students own cell phones and almost half have smart phones: “students expect their institutions to provide the kinds of resources and services they experience and enjoy as consumers. Mobile apps provide online access to instructional resources and campus services from the buttons on your smart phone.”

Also in the realm on instructional resources and services, fully three-fifths (60.5 percent) of the survey participants agree/strongly agree that “lecture capture is an important part of our campus plan for developing and delivering instructional content.” As with mobile apps, lecture capture is in the early phase of what will likely be widespread campus deployment: as of fall 2010, just 4.4 percent of courses make use of lecture capture technologies, up from 3.1 percent in fall 2008.

The survey data reveal that student activities on social networks can pose social problems for colleges and universities. Almost a sixth (15.4 percent) of campuses participating in the 2010 survey report a past year “incident” (cyberstalking; cyberbulling, etc.) linked to student activity on social networking sites this past year, up from less than a tenth (8.6 percent in 2006). Moreover, the proportion of campuses reporting incidents linked to social networking sites jumped dramatically in some sectors this past year, rising from 15.8 percent in 2009 to 27.3 percent in public universities and up from 13.6 percent to 20.8 percent in public four-year colleges.

“These rising numbers suggest it will be difficult for college and university officials to ignore the campus consequences of student behavior on social networks,” says Green. “Although Facebook and other social networks are not supported or sponsored by colleges and universities, the activities of individual students on these sites can have consequences for other students and for their institutions. Many campuses are likely to expand their user education initiatives as part of institutional efforts to address this issue.”
Senior campus IT officers appear bullish on the future of eBooks. Well over four-fifths (86.5 percent) agree or strongly agree that “eBook content will be an important source for instructional resources in five years,” up from 76.3 percent in 2009. Additionally, more than three-fourths (78.6 percent, up from 66.0 percent in2009) agree/strongly agree that “eBook readers (hardware) will be important platforms for instructional content in five years.”
“eBooks remain a much wished for, ‘ever-arriving’ technology in academe,” says Green. “The platform options, market opportunities, and enabling technologies for eBooks continue to improve.” But Green notes that for most students, eBooks and eTextbooks do not yet offer competitive alternative to used textbooks. “eTextbook development and pricing strategies are still evolving. Publishers still develop titles primarily for print, and then port print content into electronic formats. Consequently, eBooks and eTextbooks do not - yet - provide a compelling value proposition for most college students.”

The 2010 Campus Computing Survey is based on survey data provided by senior campus IT officials, typically, the CIO, CTO, or other senior campus IT officer, representing 523 two- and four-year public and private/non-profit colleges and universities across the United States. Survey respondents completed the questionnaire September and early October 2010. Copies of the 2010 Campus Computing Survey will be available on December 10th from the Campus Computing Project in Encino, CA (campuscomputing.net). Price: $37, plus $2 shipping. 
Source: http://www.campuscomputing.net/summary/2010-campus-computing-survey

'Samsung Pushes Apple Out of Top Smart Phone Slot' - OR: Sing the Song of Samsung Baking Apples Pie

By David Nagel
11/07/11

Samsung moved to the top position among smart phone manufacturers worldwide in the third quarter, bumping Apple, Nokia, and Research in Motion out of the way in the process.

According to new data published by market research firm IDC, Samsung's smart phone shipments increased 223.3 percent from Q3 2010, rising to 23.6 million units and accounting for 20 percent of the overall market. At this time last year, the company commanded only 8.8 percent of the market on shipments of 7.3 million units.

Samsung's rise in the smart phone market was driven by sales of its Android- and bada-based devices, according to IDC.

"Samsung's ascendancy to the leadership position is the direct result of its broad and deep product portfolio," said Ramon Llamas, senior research analyst with IDC's Mobile Phone Technology and Trends group, in a statement released Monday. "Ever since the first Galaxy device launched last year, the company has aggressively expanded and refreshed its selection to include the latest innovations and most popular features. At the same time, its line-up of bada-branded smart phones has earned a welcome reception within key markets."

However, Llamas noted, Samsung's leadership position "will be a challenge to maintain, both in the fourth quarter and beyond. Apple's fourth quarter launch of the iPhone 4S and lower pricing of older models will certainly boost volumes, and Nokia's recent launch of Windows Phone smart phones marks the beginning of a new era for the company. While these point to larger volumes in the quarters to come, they will also lead to increased competition."

Q3 was the first quarter in which Samsung had ever surpassed the 20 million smart phone unit sales mark, according to IDC.

Meanwhile, Apple, while losing a small market share percentage, actually increased unit shipments 21.3 percent in the quarter. The iPhone maker shipped 17.1 million units worldwide during the quarter compared with 14.1 million in Q3 2010. Its market share was 14.5 percent in Q3 2011 versus 17 percent in Q3 2010.


"Apple, after taking the No. 1 spot last quarter from Nokia, slipped to the No. 2 spot worldwide," IDC reported. "But even after relying on the iPhone 4 for five quarters and the iPhone 3G S for nine, demand for the iPhone remained strong enough for Apple to realize double-digit growth year over year. Now that Apple has launched its iPhone 4S and re-priced its older models in multiple countries, Apple stands poised to challenge Samsung for the leadership position."

No. 3 Nokia continued to tumble during the quarter, shedding nearly 10 million units in worldwide sales and dropping to a market share of 14.2 percent compared with a share of 32 percent in the same quarter last year. Its units sales of 16.8 million, however, were still enough to keep it on Apple's heels.

High-end Android phone maker HTC, like Samsung, saw a triple-digit percentage increase in unit shipments worldwide. The company has sold only 5.9 million units in Q3 2010 but increased that figure 115.3 percent to 12.7 million units in Q3 2011, winding up in the No. 4 slot with a 10.8 percent market share.

"HTC moved up one spot and maintained its upward momentum during 3Q11," IDC reported. "During the quarter, HTC acquired several companies to complement its devices, including Dashwire for cloud-based sync, Zoodles for kid-oriented applications, and a stake in audio company Beats." The company also launched an entry-level Android phone during the quarter, as well as phone targeting specific demographics.

Like Nokia, BlackBerry maker Research in Motion declined in the third quarter of 2010, moving to the No. 5 slot overall. Total shipments for the quarter were off 4.8 percent compared with Q3 2010, from 12.4 million units to 11.8 million. Market share for the three-month period declined from 15 percent in 2010 to an even 10 percent in 2011.

All other smart phone vendors accounted for 36.1 million units, up from 16.6 million in the same quarter last year, accounting for the remaining 30.6 percent of the market. Total worldwide smart phone shipments for the quarter were 118.1 million, up 42.6 percent from 82.8 million units in the same quarter in 2010.

"Vendors will struggle to maintain leadership of the global smart phone market this year given its continued high growth, which opportunities for multiple companies to grow," said Kevin Restivo, senior research analyst with IDC's Worldwide Mobile Phone Tracker, also in a prepared statement. "Competitors will release smart phones with components, such as 3D displays, dual-core processors, and enhanced audio capabilities, that will help them drive higher shipment volumes and potentially leapfrog competitors."

Source: http://campustechnology.com/articles/2011/11/07/samsung-pushes-apple-out-of-top-smart-phone-slot.aspx

Tuesday, November 15, 2011

Milwaukee Runs Provocative Ads to Wake Parents Up to Dangers of Co-Sleeping


Milwaukee Runs Provocative Ads to Wake Parents Up to Dangers of Co-Sleeping
By Edward Lovett | ABC News – 8 hrs ago

02 Shame on Milwaukee Co Sleeping Ads


As reported in the Milwaukee Journal Sentinel, the campaign, unveiled last Wednesday, includes two posters of a baby lying in a bed next to a large knife. In one, the baby is white; in the other, the baby is black. “YOUR BABY SLEEPING NEXT TO YOU CAN BE JUST AS DANGEROUS,” the copy blares.

03 Shame on Milwaukee Co Sleeping Ads

The second-leading cause of infant mortality in Milwaukee is SIDS, or sudden infant death syndrome, which often results from ”unsafe sleep,” according to the health department’s website. A form of “unsafe sleep” is bed-sharing with parents.

“Is it shocking? Is it provocative?” asked Bevan Baker, the city’s commissioner of health, according to the Journal Sentinel. ”Yes. But what is even more shocking and provocative is that 30 developed and underdeveloped countries have better [infant death] rates than Milwaukee.”
05 Shame on Milwaukee Co Sleeping Ads
The Journal Sentinel said Milwaukee had an “infant mortality crisis.” Milwaukee’s infant mortality rate in 2009 was 10.4 deaths for every 1,000 live births, according to the city’s health department. As noteworthy as this overall rate is the racial breakdown: For white babies, the rate was 5.4; for blacks, 14.1, the JS said.

The city has set a goal of reducing the infant mortality rate for blacks by 15 percent, and the overall rate by 10 percent by 2017, the JS said.

“Shame on Milwaukee Co-Sleeping Ads” was the title of Danielle625's post on Baby’s First Year, a blog on the parenting website Babble. She co-slept with her three children and said co-sleeping — when “done safely” — was harmless, even beneficial, citing a page on the prominent parenting website Ask Dr. Sears.

A commenter on the post wrote: “As a Milwaukee resident and co-sleeper, I am hardly fazed by these ads. Milwaukee has an extremely high infant mortality rate and an alarming African American infant mortality rate. Unsafe sleeping conditions have been cited as a contributing factor to that rate.”

Raquel Filmanowicz, communications officer for the Milwaukee Health Department, said the city ran similarly provocative ads a year and a half ago, and received an overwhelmingly positive response. All ads follow up on the initial shock they may cause by offering a phone number for parents to call to receive a free Pack ‘N Play, a collapsible crib, she said.

“I’ll take some heat,” Mayor Tom Barrett told ABC News. ”Some ZIP codes in Milwaukee have infant mortality rates higher than Third World countries. That’s unacceptable.”

“If the ads make some people uncomfortable, I guarantee it’s a lot less uncomfortable than having another baby die from co-sleeping,” a cause of death that is “so preventable,” he added.

04 Shame on Milwaukee Co Sleeping Ads

Monday, November 14, 2011

Sony Puts Roland Emmerich's Singularity On Hold

Sony Puts Roland Emmerich's Singularity On Hold

Posted 11.12.11 by BrentJS

After getting the green light from Sony to move forward with his new sci-fi movie,Singularity, co-writer (with Harald Kloser) and director Roland Emmerich has halted pre-production on the movie. Some sources have claimed that the movie was put on hold because of Sony's dissatisfaction with the box office performance of Emmerich's latest movie for the studio, Anonymous, a $30 million period movie that has grossed less than $5 million in its first two weeks in theaters. However, Deadline has reported the decision stems from the desire to bring in an expert to help hone some of the futuristic concepts in the script.

Little is known about Singularity at this point, other than the fact that it takes place 40 years in the future, at a time when we are in "danger of losing control" of our advanced computer technology, and centers around a young man named Adam "whose body is made up a swarm of nanobots, giving him all sorts of power." Given the subject matter and the title of the movie — a "technological singularity" refers to the emergence of a technological super-intelligence, the creation of which will result in an "intellectual event horizon beyond which the future becomes difficult to understand or predict" — it appears as if the technology that we are in "danger of losing control" of might be Adam himself (itself?). According to Deadline, Sony has brought in bestselling author, inventor and futurist Ray Kurzweil (actually, Deadline wrote that Sony hired "Ray Kurzwell," but we're pretty sure that was simply a typo), to help Emmerich and Kloser with some of the more tech-heavy aspects of the Singularity script.

Due to the suspension of pre-production, the start date is expected to be pushed back several months from the original March 2012 date, though Deadline reported Sony intends to "stay on track" for its May 2013 release date. No mention was made of whether or not the decision to put the movie on hold was made before or after Emmerich was to supposed to have screened a bunch of young actors — Luke Grimes(Shit Year), Logan Marshall-Green (upcoming Prometheus), Juliane Morris (Sorority Row), Thomas McDonell (upcoming Dark Shadows) and others — for the part of Adam


Source: http://www.reelz.com/movie-news/12294/sony-puts-roland-emmerichs-singularity-on-hold/

Too many laws, too many prisoners

Too many laws, too many prisoners
Jul 22nd 2010 | SPRING, TEXAS


Never in the civilised world have so many been locked up for so little


THREE pickup trucks pulled up outside George Norris’s home in Spring, Texas. Six armed police in flak jackets jumped out. Thinking they must have come to the wrong place, Mr Norris opened his front door, and was startled to be shoved against a wall and frisked for weapons. He was forced into a chair for four hours while officers ransacked his house. They pulled out drawers, rifled through papers, dumped things on the floor and eventually loaded 37 boxes of Mr Norris’s possessions onto their pickups. They refused to tell him what he had done wrong. “It wasn’t fun, I can tell you that,” he recalls.

Mr Norris was 65 years old at the time, and a collector of orchids. He eventually discovered that he was suspected of smuggling the flowers into America, an offence under the Convention on International Trade in Endangered Species. This came as a shock. He did indeed import flowers and sell them to other orchid-lovers. And it was true that his suppliers in Latin America were sometimes sloppy about their paperwork. In a shipment of many similar-looking plants, it was rare for each permit to match each orchid precisely.

In March 2004, five months after the raid, Mr Norris was indicted, handcuffed and thrown into a cell with a suspected murderer and two suspected drug-dealers. When told why he was there, “they thought it hilarious.” One asked: “What do you do with these things? Smoke ’em?”


Prosecutors described Mr Norris as the “kingpin” of an international smuggling ring. He was dumbfounded: his annual profits were never more than about $20,000. When prosecutors suggested that he should inform on other smugglers in return for a lighter sentence, he refused, insisting he knew nothing beyond hearsay.

He pleaded innocent. But an undercover federal agent had ordered some orchids from him, a few of which arrived without the correct papers. For this, he was charged with making a false statement to a government official, a federal crime punishable by up to five years in prison. Since he had communicated with his suppliers, he was charged with conspiracy, which also carries a potential five-year term.

As his legal bills exploded, Mr Norris reluctantly changed his plea to guilty, though he still protests his innocence. He was sentenced to 17 months in prison. After some time, he was released while his appeal was heard, but then put back inside. His health suffered: he has Parkinson’s disease, which was not helped by the strain of imprisonment. For bringing some prescription sleeping pills into prison, he was put in solitary confinement for 71 days. The prison was so crowded, however, that even in solitary he had two room-mates.

A long love affair with lock and key


Justice is harsher in America than in any other rich country. Between 2.3m and 2.4m Americans are behind bars, roughly one in every 100 adults. If those on parole or probation are included, one adult in 31 is under “correctional” supervision. As a proportion of its total population, America incarcerates five times more people than Britain, nine times more than Germany and 12 times more than Japan. Overcrowding is the norm. Federal prisons house 60% more inmates than they were designed for. State lock-ups are only slightly less stuffed.

The system has three big flaws, say criminologists. First, it puts too many people away for too long. Second, it criminalises acts that need not be criminalised. Third, it is unpredictable. Many laws, especially federal ones, are so vaguely written that people cannot easily tell whether they have broken them.

In 1970 the proportion of Americans behind bars was below one in 400, compared with today’s one in 100. Since then, the voters, alarmed at a surge in violent crime, have demanded fiercer sentences. Politicians have obliged. New laws have removed from judges much of their discretion to set a sentence that takes full account of the circumstances of the offence. Since no politician wants to be tarred as soft on crime, such laws, mandating minimum sentences, are seldom softened. On the contrary, they tend to get harder.


Some criminals belong behind bars. When a habitual rapist is locked up, the streets are safer. But the same is not necessarily true of petty drug-dealers, whose incarceration creates a vacancy for someone else to fill, argues Alfred Blumstein of Carnegie Mellon University. The number of drug offenders in federal and state lock-ups has increased 13-fold since 1980. Some are scary thugs; many are not.

Michelle Collette of Hanover, Massachusetts, sold Percocet, a prescription painkiller. “I was planning to do it just once,” she says, “but the money was so easy. And I thought: it’s not heroin.” Then she became addicted to her own wares. She was unhappy with her boyfriend, she explains, but did not want to split up with him, because she did not want their child to grow up fatherless, as she had. So she popped pills to numb the misery. Before long, she was taking 20-30 a day.

When Ms Collette and her boyfriend, who also sold drugs, were arrested in a dawn raid, the police found 607 pills and $901 in cash. The boyfriend fought the charges and got 15 years in prison. In a plea bargain Ms Collette was sentenced to seven years, of which she served six.

“I don’t think this is fair,” said the judge. “I don’t think this is what our laws are meant to do. It’s going to cost upwards of $50,000 a year to have you in state prison. Had I the authority, I would send you to jail for no more than one year…and a [treatment] programme after that.” But mandatory sentencing laws gave him no choice.

Massachusetts is a liberal state, but its drug laws are anything but. It treats opium-derived painkillers such as Percocet like hard drugs, if illicitly sold. Possession of a tiny amount (14-28 grams, or ½-1 ounce) yields a minimum sentence of three years. For 200 grams, it is 15 years, more than the minimum for armed rape. And the weight of the other substances with which a dealer mixes his drugs is included in the total, so 10 grams of opiates mixed with 190 grams of flour gets you 15 years.

Ms Collette underwent drug treatment before being locked up, and is now clean. But in prison she found she was pregnant. After going through labour shackled to a hospital bed, she was allowed only 48 hours to bond with her newborn son. She was released in March, found a job in a shop, and is hoping that her son will get used to having her around.

Rigid sentencing laws shift power from judges to prosecutors, complains Barbara Dougan of Families Against Mandatory Minimums, a pressure-group. Even the smallest dealer often has enough to trigger a colossal sentence. Prosecutors may charge him with selling a smaller amount if he agrees to “reel some other poor slob in”, as Ms Dougan puts it. He is told to persuade another dealer to sell him just enough drugs to trigger a 15-year sentence, and perhaps to do the deal near a school, which adds another two years.

Severe drug laws have unintended consequences. Less than half of American cancer patients receive adequate painkillers, according to the American Pain Foundation, another pressure-group. One reason is that doctors are terrified of being accused of drug-trafficking if they over-prescribe. In 2004 William Hurwitz, a doctor specialising in the control of pain, was sentenced to 25 years in prison for prescribing pills that a few patients then resold on the black market. Virginia’s board of medicine ruled that he had acted in good faith, but he still served nearly four years.

Half the states have laws that lock up habitual offenders for life. In some states this applies only to violent criminals, but in others it applies even to petty ones. Some 3,700 people who committed neither violent nor serious crimes are serving life sentences under California’s “three strikes and you’re out” law. In Alabama a petty thief called Jerald Sanders was given a life term for pinching a bicycle. Alabama’s judges are elected, as are those in 32 other states. This makes them mindful of public opinion: some appear in campaign advertisements waving guns and bragging about how tough they are.
Watching hairs go white, and lifetimes ebb away

Many Americans assume that white-collar criminals get off lightly, but many do not. Granted, they may be hard to catch and can often afford good lawyers. But federal prosecutors can file many charges for what is essentially one offence. For example, they can count each e-mail sent by a white-collar criminal in the course of his criminal activity as a separate case of wire fraud, each of which carries a maximum sentence of 20 years. The decades soon add up. Sentences depend partly on the size of the loss and the number of people affected, so if you work for a big, publicly traded company, you break a rule and the share-price drops, watch out.

Eternal punishment

Jim Felman, a defence lawyer in Tampa, Florida, says America is conducting “an experiment in imprisoning first-time non-violent offenders for periods of time previously reserved only for those who had killed someone”. One of Mr Felman’s clients, a fraudster called Sholam Weiss, was sentenced to 845 years. “I got it reduced to 835,” sighs Mr Felman. Faced with such penalties, he says, the incentive to co-operate, which means to say things that are helpful to the prosecution, is overwhelming. And this, he believes, “warps the truth-seeking function” of justice.

Innocent defendants may plead guilty in return for a shorter sentence to avoid the risk of a much longer one. A prosecutor can credibly threaten a middle-aged man that he will die in a cell unless he gives evidence against his boss. This is unfair, complains Harvey Silverglate, the author of “Three Felonies a Day: How the Feds Target the Innocent”. If a defence lawyer offers a witness money to testify that his client is innocent, that is bribery. But a prosecutor can legally offer something of far greater value—his freedom—to a witness who says the opposite. The potential for wrongful convictions is obvious.

Badly drafted laws create traps for the unwary. In 2006 Georgia Thompson, a civil servant in Wisconsin, was sentenced to 18 months in prison for depriving the public of “the intangible right of honest services”. Her crime was to award a contract (for travel services) to the best bidder. A firm called Adelman Travel scored the most points (on an official scale) for price and quality, so Ms Thompson picked it. She ignored a rule that required her to penalise Adelman for a slapdash presentation when bidding. For this act of common sense, she served four months. (An appeals court freed her.)

The “honest services” statute, if taken seriously, “would seemingly cover a salaried employee’s phoning in sick to go to a ball game,” fumes Antonin Scalia, a Supreme Court justice. The Supreme Court ruled recently that the statute was so vague as to be unconstitutional. It did not strike it down completely, but said it should be applied only in cases involving bribery or kickbacks. The challenge was brought by Enron’s former boss, Jeff Skilling, who will not go free despite his victory, and Conrad Black, a media magnate released this week on bail pending an appeal, who may.

There are over 4,000 federal crimes, and many times that number of regulations that carry criminal penalties. When analysts at the Congressional Research Service tried to count the number of separate offences on the books, they were forced to give up, exhausted. Rules concerning corporate governance or the environment are often impossible to understand, yet breaking them can land you in prison. In many criminal cases, the common-law requirement that a defendant must have a mens rea (ie, he must or should know that he is doing wrong) has been weakened or erased.

“The founders viewed the criminal sanction as a last resort, reserved for serious offences, clearly defined, so ordinary citizens would know whether they were violating the law. Yet over the last 40 years, an unholy alliance of big-business-hating liberals and tough-on-crime conservatives has made criminalisation the first line of attack—a way to demonstrate seriousness about the social problem of the month, whether it’s corporate scandals or e-mail spam,” writes Gene Healy, a libertarian scholar. “You can serve federal time for interstate transport of water hyacinths, trafficking in unlicensed dentures, or misappropriating the likeness of Woodsy Owl.”

“You’re (probably) a federal criminal,” declares Alex Kozinski, an appeals-court judge, in a provocative essay of that title. Making a false statement to a federal official is an offence. So is lying to someone who then repeats your lie to a federal official. Failing to prevent your employees from breaking regulations you have never heard of can be a crime. A boss got six months in prison because one of his workers accidentally broke a pipe, causing oil to spill into a river. “It didn’t matter that he had no reason to learn about the [Clean Water Act’s] labyrinth of regulations, since he was merely a railroad-construction supervisor,” laments Judge Kozinski.
Society wants retribution

Such cases account for only a tiny share of the Americans behind bars, but they still matter. When so many people are technically breaking the law, it is up to prosecutors to decide whom to pursue. No doubt most prosecutors choose wisely. But members of unpopular groups may not find that reassuring. Ms Thompson, for example, was prosecuted just before an election, at a time when allegations of public corruption in Wisconsin were in the news. Some prosecutors, such as Eliot Spitzer, the disgraced ex-governor of New York, have built political careers by nailing people whom voters don’t like, such as financiers.

Prison deters? Not much, not the worst

Some people argue that the system works: that crime has fallen in the past two decades because the bad guys are either in prison or scared of being sent there. Caged thugs cannot break into your home. Bernie Madoff’s 150-year sentence for running a Ponzi scam should deter imitators. And indeed the crime rate continues to drop, despite the recession, as Michael Rushford of the Criminal Justice Legal Foundation, an advocacy group, points out. This, he says, is because habitual criminals face serious consequences. Some research supports him: after raking through decades of historical data, John Donohue of Yale Law School estimates that a 10% increase in imprisonment brings a 2% reduction in crime.

Others disagree. Using more recent data, Bert Useem of Purdue University and Anne Piehl of Rutgers University estimate that a 10% increase in the number of people behind bars would reduce crime by only 0.5%. In the states that currently lock up the most people, imprisoning more would actually increase crime, they believe. Some inmates emerge from prison as more accomplished criminals. And raising the incarceration rate means locking up people who are, on average, less dangerous than the ones already behind bars. A recent study found that, over the past 13 years, the proportion of new prisoners in Florida who had committed violent crimes fell by 28%, whereas those inside for “other” crimes shot up by 189%. These “other” crimes were non-violent ones involving neither drugs nor theft, such as driving with a suspended licence.

And now the reckoning, in dollars

Crime is a young man’s game. Muggers over 30 are rare. Ex-cons who go straight for a few years generally stay that way: a study of 88,000 criminals by Mr Blumstein found that if someone was arrested for aggravated assault at the age of 18 but then managed to stay out of trouble until the age of 22, the risk of his offending was no greater than that for the general population. Yet America’s prisons are crammed with old folk. Nearly 200,000 prisoners are over 50. Most would pose little threat if released. And since people age faster in prison than outside, their medical costs are vast. Human Rights Watch, a lobby-group, talks of “nursing homes with razor wire”.

Jail is expensive. Spending per prisoner ranges from $18,000 a year in Mississippi to about $50,000 in California, where the cost per pupil is but a seventh of that. “[W]e are well past the point of diminishing returns,” says a report by the Pew Center on the States. In Washington state, for example, each dollar invested in new prison places in 1980 averted more than nine dollars of criminal harm (using a somewhat arbitrary scale to assign a value to not being beaten up). By 2001, as the emphasis shifted from violent criminals to drug-dealers and thieves, the cost-benefit ratio reversed. Each new dollar spent on prisons averted only 37 cents’ worth of harm.

Since the recession threw their budgets into turmoil, many states have decided to imprison fewer people, largely to save money. Mississippi has reduced the proportion of their sentences that non-violent offenders are required to serve from 85% to 25%. Texas is making greater use of non-custodial penalties. New York has repealed most mandatory minimum terms for drug offences. In all, the number of prisoners in state lock-ups fell by 0.3% in 2009, the first fall since 1972. But the total number of Americans behind bars still rose slightly, because the number of federal prisoners climbed by 3.4%.

A less punitive system could work better, argues Mark Kleiman of the University of California, Los Angeles. Swift and certain penalties deter more than harsh ones. Money spent on prisons cannot be spent on more cost-effective methods of crime-prevention, such as better policing, drug treatment or probation. The pain that punishment inflicts on criminals themselves, on their families and on their communities should also be taken into account.

“Just by making effective use of things we already know how to do, we could reasonably expect to have half as much crime and half as many people behind bars ten years from now,” says Mr Kleiman. “There are a thousand excuses for failing to make that effort, but not one good reason.”

Source: http://www.economist.com/node/16636027


* * * * *

1 in 100 U.S. Adults Behind Bars, New Study Says
By ADAM LIPTAK
February 28, 2008

Growth in Incarceration

For the first time in the nation’s history, more than one in 100 American adults is behind bars, according to a new report.

Nationwide, the prison population grew by 25,000 last year, bringing it to almost 1.6 million. Another 723,000 people are in local jails. The number of American adults is about 230 million, meaning that one in every 99.1 adults is behind bars.

Incarceration rates are even higher for some groups. One in 36 Hispanic adults is behind bars, based on Justice Department figures for 2006. One in 15 black adults is, too, as is one in nine black men between the ages of 20 and 34.

The report, from the Pew Center on the States, also found that only one in 355 white women between the ages of 35 and 39 are behind bars but that one in 100 black women are.

The report’s methodology differed from that used by the Justice Department, which calculates the incarceration rate by using the total population rather than the adult population as the denominator. Using the department’s methodology, about one in 130 Americans is behind bars.

Either way, said Susan Urahn, the center’s managing director, “we aren’t really getting the return in public safety from this level of incarceration.”

But Paul Cassell, a law professor at the University of Utah and a former federal judge, said the Pew report considered only half of the cost-benefit equation and overlooked the “very tangible benefits — lower crime rates.”

In the past 20 years, according the Federal Bureau of Investigation, violent crime rates fell by 25 percent, to 464 for every 100,000 people in 2007 from 612.5 in 1987.

“While we certainly want to be smart about who we put into prisons,” Professor Cassell said, “it would be a mistake to think that we can release any significant number of prisoners without increasing crime rates. One out of every 100 adults is behind bars because one out of every 100 adults has committed a serious criminal offense.”

Ms. Urahn said the nation cannot afford the incarceration rate documented in the report. “We tend to be a country in which incarceration is an easy response to crime,” she said. “Being tough on crime is an easy position to take, particularly if you have the money. And we did have the money in the ‘80s and ‘90s.”

Now, with fewer resources available, the report said, “prison costs are blowing a hole in state budgets.” On average, states spend almost 7 percent on their budgets on corrections, trailing only healthcare, education and transportation.

In 2007, according to the National Association of State Budgeting Officers, states spent $44 billion in tax dollars on corrections. That is up from $10.6 billion in 1987, a 127 increase once adjusted for inflation. With money from bonds and the federal government included, total state spending on corrections last year was $49 billion. By 2011, the report said, states are on track to spend an additional $25 billion.

It cost an average of $23,876 dollars to imprison someone in 2005, the most recent year for which data were available. But state spending varies widely, from $45,000 a year in Rhode Island to $13,000 in Louisiana.

The cost of medical care is growing by 10 percent annually, the report said, and will accelerate as the prison population ages.

About one in nine state government employees works in corrections, and some states are finding it hard to fill those jobs. California spent more than $500 million on overtime alone in 2006.

The number of prisoners in California dropped by 4,000 last year, making Texas’s prison system the nation’s largest, at about 172,000. But the Texas legislature last year approved broad changes to the corrections system there, including expansions of drug treatment programs and drug courts and revisions to parole practices.

“Our violent offenders, we lock them up for a very long time — rapists, murderers, child molestors,” said John Whitmire, a Democratic state senator from Houston and the chairman of the state senate’s criminal justice committee. “The problem was that we weren’t smart about nonviolent offenders. The legislature finally caught up with the public.”

He gave an example.

“We have 5,500 D.W.I offenders in prison,” he said, including people caught driving under the influence who had not been in an accident. “They’re in the general population. As serious as drinking and driving is, we should segregate them and give them treatment.”

The Pew report recommended diverting nonviolent offenders away from prison and using punishments short of reincarceration for minor or technical violations of probation or parole. It also urged states to consider earlier release of some prisoners.

Before the recent changes in Texas, Mr. Whitmire said, “we were recycling nonviolent offenders.”


* * * * *

Incarceration Rates Growth Causes

  • Oregon Corrections Population Forecast [PDF] State of Oregon Office of Economic Analysis. October, 2011. "The number of inmates housed in Oregon's prisons, currently about 14,000, is expected grow to 16,000 inmates by the end of the decade, with much of that growth occurring over the next four years."
  • Arrest In The United States, 1980-2009 [PDF] Bureau of Justice Statistics. September, 2011. "The U.S. murder arrest rate in 2009 was about half of what it was in the early 1980s. Over the 30-year period ending in 2009, the adult arrest rate for murder fell 57%, while the juvenile arrest rate fell 44%."
  • Smart Reform is Possible States Reducing Incarceration Rates and Costs While Proecting Communities, [PDF] ACLU. August, 2011. "As states across the country are realizing that reducing prison populations and corrections budgets is a necessity, they can look to the examples in this report as ways to reform their criminal justice systems with promising results."
  • Misguided Measures The Outcomes and Impacts of Measure 11 on Oregon's Youth, [PDF] Partnership for Safety and Justice. July, 2011. "Over the three-year period from 2006 to 2008, data from the 36 Oregon counties show no discernible pattern between the number of young people charged with a Measure 11 offense and the juvenile crime rate."
  • Creating the Roadmap for Reduction Reducing the Number of Women in Prison in Alabama, [PDF] Justice Policy Institute. April, 2011. "In the summer of 2009, Corrections and JPI staff recognized the opportunity to expedite the reclassification of currently-incarcerated women using the new classification module and the need to add capacity to identify women who can be safely released."
  • (New) Approaches to reducing both imprisonment and crime [PDF] Criminology & Public Policy. February, 2011. "It may well be that more and stronger policing is the best way to use [...] resources, but that case is far less clear than the desirability of reducing severity."
  • (New) On the pitfalls of spurious prudence [PDF] Criminology & Public Policy. February, 2011. "[W]e need to situate how we think about resources for policing in the context of a larger strategy for creating a healthier and safer society that also includes what we might call “deep” prevention."
  • (New) The challenges of implementing research-based policies [PDF] Criminology & Public Policy. February, 2011. "[I]t is opportune to consider how finite criminal justice resources could be used more strategically and effectively. Durlauf and Nagin (2011) have laid out an agenda that provides a research- based strategy for reducing both crime and incarceration."
  • (New) Imprisonment and crime: Can both be reduced? [PDF] Criminology & Public Policy. February, 2011. "In this article, we argue that it is a realistic possibility that crime, prison costs, and imprisonment numbers can be reduced simultaneously if policy makers shift their [to a] o a focus on a more effective use of police."
  • The State of Sentencing 2010 Developments in Policy and Practice, [PDF] Sentencing Project. February, 2011. "During 2010, state legislatures in at least 23 states and the District of Columbia adopted 35 [...] policies that may contribute to reductions in the prison population and eliminate barriers to reentry while promoting effective approaches to public safety"
  • Jails in Indian Country, 2009 [PDF] Bureau of Justice Statistics. February, 2011. "Over the 12 months ending June 2009, the average daily jail population in Indian country increased by 12%, and the percentage of occupied bed space increased from 64.2% to 73.5%."
  • When More is Less How a Larger Women's Jail in Baltimore will Reduce Public Safety and Diminish Resources for Positive Social Investments, [PDF] Justice Policy Institute. January, 2011. "Given that research indicates that increased incarceration does not equal less crime—it actually is the opposite — the negative public safety, economic and community impacts of the planned expansion are not justifiable."
  • Correctional Populations In The United States, 2009 Bureau of Justice Statistics, [PDF] Bureau of Justice Statistics. December, 2010. "The rate of decline in the jail population during 2009 was the highest rate of change observed among all four correctional populations, including the probation, parole, jail, and prison populations."
  • Texas' School-to-Prison Pipeline Ticketing, Arrest & Use of Force in Schools, [PDF] Texas Appleseed. December, 2010. "Where a child attends school, and not the nature of the offense, is the great determining factor in whether a student will be arrested at school."
  • Prisoners in 2009 [PDF] Bureau of Justice Statistics. December, 2010. "The imprisonment rate—the number of sentenced prison- ers per 100,000 U.S. residents—declined for the second straight year, falling to 502 per 100,000 from 506 per 100,000 in 2007."
  • California Sentencing Institute Center on Juvenile and Criminal Justice. November, 2010. "comprehensive analysis of sentencing policies and practices in all of California’s 58 counties."(Contains detailed county-level statistics)
  • Preventable Error A Report on Prosecutorial Misconduct in California 1997�" 2009, [PDF] Northern California Innocence Project, Santa Clara University School of Law. October, 2010. "[This report] is the most comprehensive, up-to-date, quantitative and actionable study on the extent of prosecutorial misconduct in CA, how the justice system identifies and addresses it, and its cost and consequences, including [wrongful convictions]."
  • Incarceration and Social Inequality [PDF] Bruce Western & Becky Pettit. August, 2010. "The social inequality produced my mass incarceration is sizable and enduring for three reasons: it is invisible, it is cumulative, and it is intergenerational."
  • Philadelphia's Crowded, Costly Jails: The Search for Safe Solutions, Pew Charitable Trusts. May, 2010.
  • Prison Count 2010 State Population Declines for the First Time in 38 Years, [PDF] Pew Center on the States. April, 2010. "[A]s of January 1, 2010, there were 1,404,053 persons under the jurisdiction of state prison authorities, 4,777 (0.3 percent) fewer than there were on December 31, 2008. This marks the first year-to-year drop in the state prison population since 1972."
  • Integration Debate Two Tiered Justice, [PDF] Marc Mauer, Sentencing Project. January, 2010. "[I]n the most profound betrayal of the promise of integration and opportunity, the United States has created a world-record prison population, fueled by policies that have exposed substantial portions of African Americans to the.. criminal justice system."
  • The State of Sentencing 2009 Developments in Policy and Practice, [PDF] Sentencing Project. January, 2010. "During 2009 state legislatures in at least 19 states enacted policies that hold the potential to reduce prison populations and/or promote more effective approaches to public safety."
  • Probation and Parole in the United States, 2008 Bureau of Justice Statistics. December, 2009. "The report examines… changes in the probation and parole populations, such as the number of entries and exits, the rate at which probationers and parolees exit supervision, changes in the populations within jurisdictions, and compositional changes."
  • Fact Sheet DOJ Report on Prisoners 2008, [PDF] Justice Policy Institute. December, 2009. (The report shows that although the growth in imprisonment is down, the number of people in prison is still increasing, up more than 12,000 people from last year. This number continues to grow even as crime goes down.)
  • Jails in Indian Country, 2008 Bureau of Justice Statistics. December, 2009. "The report includes data on the number of adults and juveniles held, type of offense, number of persons confined on the last weekday of each month, average daily population, peak population, and admissions in June 2008."
  • Prisoners in 2008 Bureau of Justice Statistics. December, 2009. "These are the only comprehensive national-level data on prison admissions and releases."
  • Michigan Breaks the Political Logjam A New Model for Reducing Prison Populations, [PDF] ACLU. November, 2009. "[Michigan's] new policies are designed to provide offenders with individualized programing in prison, and re-entry services upon release, that are most likely to assure success on parole, based on evidence of what works to reduce crime and save money."
  • Michigan Breaks the Political Logjam: A New Model for Reducing Prison Populations, [PDF] Prison Project of the ACLU. November, 2009.
  • Racial Disparities in the Criminal Justice System [PDF] Sentencing Project. October, 2009. ([An] overview of the factors that contribute to racial disparity in the justice system, and recommend[ed] changes in policy and practice that could reduce these disparities without compromising public safety.)
  • Fact Sheet Response to 2008 FBI Uniform Crime Report, [PDF] Justice Policy Institute. September, 2009. (The 2008 FBI Uniform Crime Report shows that during 2008, at a time in which prison and jail growth rates dropped, the United States experienced a 1.9 percent decline in violent crimes and a 0.8 percent decline in property crimes reported.)
  • Denying parole at first eligibility How much public safety does it actually buy?, [PDF] Citizens Alliance on Prisons and Public Spending. August, 2009. "Substantially increasing the rate of parole on the earliest release date would reduce the prisoner population without threatening public safety."
  • No Exit: The Expanding Use of Life Sentences in America Sentencing Project. July, 2009. "A record 140,610 individuals are now serving life sentences in state and federal prisons, 6,807 of whom were juveniles at the time of the crime."
  • Pruning Prisons How Cutting Corrections Can Save Money and Protect Public Safety, [PDF] Justice Policy Institute. May, 2009. (The United States spends spend billions to incarcerate people in prisons and jails with little impact on public safety, but redirecting funds to community-based alternatives will decrease prison populations, save money, and preserve public safety.)
  • Parental Imprisonment, the Prison Boom, and the Concentration of Childhood Disadvantage, [PDF] Christopher Wildeman. May, 2009. "Parental imprisonment has emerged as a novel—and distinctively American—childhood risk that is concentrated among black children and children of low-education parents."
  • Fact Sheet on FY2010 Department of Justice Budget [PDF] Justice Policy Institute. May, 2009. (The Factsheet on 2010 Department of Justice Budget finds that the 2010 DOJ budget directs more money to law enforcement than prevention with the likely long-term outcome being increased arrests, incarceration, and money spent on corrections.)
  • Bearing Witness Baltimore City's Residents Give Voice to What's Needed to Fix the Criminal Justice System, [PDF] Justice Policy Institute. April, 2009. (Bearing Witness captures the perspectives of the people of Baltimore City impacted by the criminal justice system and their suggestions for alternatives to addressing social problems.)
  • Jailing Communities The Impact of Jail Expansion and Effective Public Safety Strategies, [PDF] Justice Policy Institute. April, 2009. "In 2006, prison population growth was half what it was in 1996, but in recent years, jail population growth has exceeded that of prisons."
  • The Changing Racial Dynamics of the War on Drugs [PDF] Sentencing Project. April, 2009. "Reports a sharp decline in black incarceration for drug offenses for the first time in 25 years."
  • Judging Maryland Baltimore Judges on Effective Solutions to Working with Substance Abusers in the Criminal Justice System, [PDF] Justice Policy Institute. March, 2009. "Judges recommend an increase in or expansion of residential care facilities and a more holistic ap- proach to helping substance abusers caught up in the criminal justice system."
  • One in 31: The Long Reach of American Corrections, [PDF] The Pew Center on the States. March, 2009. "For eight geographically diverse states [...] 88% of the increase in corrections spending was directed towards prisons, which now consume nearly nine out of every ten state corrections dollars."
  • The Release Valve: Parole in Maryland, [PDF] Justice Policy Institute. March, 2009. "[I]n 2007 [Maryland] spent approximately $1,422 per person on parole or probation, and $33,310 per person incarcerated."
  • Prisoners in 2007 [PDF] Bureau of Justice Statistics. December, 2008. "At yearend 2007, federal and state prisons and local jails held just under 2.3 million inmates (2,293,157). The number of inmates incarcerated in prison or jail increased by 1.5% during the year."
  • Jails in Indian Country, 2007 [PDF] Bureau of Justice Statistics. November, 2008. "Eighty-three jails in Indian country held an estimated 2,163 inmates at midyear 2007, up from 1,745 inmates held in 68 facilities at midyear 2004."
  • Census of State and Federal Correctional Facilities, 2005 [PDF] Bureau of Justice Statistics. October, 2008. "The number of prisoners held in custody in state and federal correctional facilities increased 10% from 1,305,253 in 2000 to 1,430,208 in 2005."
  • Federal Justice Statistics, 2005 [PDF] Bureau of Justice Statistics. September, 2008. "In 2005, immigration (27%) was the most prevalent arrest offense followed by drug (24%) and supervision violations (17%)."
  • Parents in Prison and Their Minor Children [PDF] Bureau of Justice Statistics. August, 2008. "Parents held in the nation’s prisons—52% of state inmates and 63% of federal inmates—reported having an estimated 1,706,600 minor children, accounting for 2.3% of the U.S. resident population under age 18."
  • Prison Inmates at Midyear 2007 [PDF] Bureau of Justice Statistics. June, 2008. "Between January and June 2007, the prison population increased by 1.6% (or 24,919 prisoners), compared to a 2% increase during the first six months of 2006."
  • Growth in Michigan's Corrections System: Historical and Comparative Perspectives, [PDF] Citizen's Research Counsel of Michigan. June, 2008. "Michigan’s prison population growth is the product of a combination of several different factors including: increases in felony dispositions, swelling prison commitments, higher recidivism rates, and an increased average prisoner length of stay."
  • Jail Inmates at Midyear 2007 [PDF] Bureau of Justice Statistics. June, 2008. "The total rated capacity of local jails at midyear 2007 reached 813,502 beds, up from an estimated 677,787 beds at midyear 2000."
  • Do More Prisoners Equal Less Crime? A Response to George WillSentencing Project. June, 2008. "Will's selective use of data and limited vision provide an inaccurate portrayal of current criminal justice policy and its effects. [This piece] is an assessment of some of the key arguments raised in the column."
  • One in 100: Behind Bars in America 2008, The Pew Center on the States. February, 2008. "[F]or the first time in history, more than one in every 100 adults in America are in jail or prison-a fact that significantly impacts state budgets without delivering a clear return on public safety."
  • The State of Sentencing 2007: Developments in Policy and Practice, The Sentencing Project. January, 2008. "Confronted with the high cost of continued prison growth, policymakers in 18 states took steps during 2007 to review the effectiveness of their criminal justice systems or institute reforms to limit recidivism and sentence lengths..."
  • Prisoners in 2006 [PDF] Bureau of Justice Statistics. December, 2007. "During 2006 the number of women in prison increased by 4.5%, reaching 112,498 prisoners."
  • Unlocking America: Why and How to Reduce America's Prison Population, [PDF] JFA Institute. November, 2007. "Not only are our lengths of imprisonment significantly longer than they were in earlier periods in our penal history, but they are considerably longer than in most Western nations."
  • Housing and Public Safety Justice Policy Institute. November, 2007. "For populations who are the most at-risk for criminal justice system involvement, supportive or affordable housing has been shown to be a cost effective public investment."
  • Justice, Where Art Thou? A Framework for the Future, Council on Crime and Justice. October, 2007. (This report analysies past and current incarceration trends in Minnesotra and makes projection through the year 2030.)
  • Felony Sentences in State Courts, 2004 [PDF] Bureau of Justice Statistics. July, 2007. "Between 1994 and 2004, the number of felony convictions in State courts increased 24%."
  • Prison and Jail Inmates at Midyear 2006 [PDF] Bureau of Justice Statistics. June, 2007. "For the 12 months ending June 30, 2006, State systems reported a larger increase than the Federal system in the number of inmates housed in private prisons."
  • Changing Direction? State Sentencing Reforms 2004-2006, [PDF] The Sentencing Project. March, 2007. "The report... identifies that the most popular approach for reducing prison crowding -- implemented by 13 states -- was the diversion of low-level drug offenders from prison to drug treatment programs."
  • The Myth of Immigrant Criminality and the Paradox of Assimilation:Incarceration Rates among Native and Foreign-Born Men, American Immigration Law Foundation. February, 2007. "[F]or every ethnic group without exception, incarceration rates among young men are lowest for immigrants, even those who are the least educated."
  • Public Safety, Public Spending: Forecasting America's Prison Population 2007-2011, [PDF] Public Safety Performance Project of The Pew Charitable Trusts. February, 2007. "This report provides forecasts for prison populations and incarceration rates for all 50 states."
  • World Prison Population List. Eighth ed. Roy Walmsley, International Centre for Prison Studies, King's College London. February, 2007. "Over 9.8 million people are incarcerated, with over 30% held in the Unites States."
  • Addressing Key Criminal Justice Issues in the 21st Century [PDF] The Correctional Association of New York. February, 2007. "This special report presents some of our top reform proposals for the state's new administration to consider and the benefits they will provide for people caught up in the criminal justice system and for society as a whole."
  • Solving California's Corrections Crisis: Time is Running Out, Milton Marks. January, 2007. "California's correctional system is in a tailspin that threatens public safety and raises the risk of fiscal disaster."(An overview of the current state of the California corrections system, with recommendations.)
  • Reconsidering Incarceration: New Directions for Reducing Crime, Vera Institute of Justice. January, 2007. "An increase in the number of police per capita, a reduction in unemployment, and increases in real wage rates and education have all been shown to be associated with lower rates of crime."
  • The Criminal Justice System in Washington State: Incarceration Rates, Taxpayer Costs, Crime Rates, and Prison Economics, Washington State Institute for Public Policy. 2007. (In Washington state increasing the rate of incarceration reduces crime rates, however because of diminishing returns, the proportional decrease in crime is much lower now than it was in the 1980's.)
  • Race and Incarceration in Delaware: A Preliminary Consideration, [PDF] Thomas P. Eichler, Published by Delaware Center for Justice and Metropolitan Wilmington Urban League. 2007. "Delaware’s criminal justice system treats Blacks differently and far less favorably than similarly situated Whites. The data shows that the racial disparities in the criminal justice system are increasing."
  • Prisoners in 2005 [PDF] Bureau of Justice Statistics. November, 2006. "State prisons were operating between 1% below and 14% above capacity; Federal prisons were operating at 34% above capacity."
  • Probation and Parole in the United States, 2005 [PDF] Bureau of Justice Statistics. November, 2006. "In 2005 the Nation's parole population grew 1.6%. This was an increase of 12,556 parolees during the year."
  • 2006 Crime and Justice Index [PDF] Chicago Metropolis 2020. October, 2006. "This Index presents data on crime trends and justice patterns in the region over time. It also explores specific policy issues and some promising practices intended to address seemingly intractable problems in the criminal justice systems."
  • Evidence-Based Public Policy Options to Reduce Future Prison Construction, Criminal Justice Costs, and Crime Rates, Washington State Institute for Public Policy. October, 2006. "We find that some evidence-based programs can reduce crime, but others cannot. Per dollar of spending, several of the successful programs produce favorable returns on investment."
  • Estimated Prevalence of Felons Among the Oklahoma Adult Population [PDF] Oklahoma Criminal Justice Resource Center. September, 2006. "Nearly one in seven adult males and one in every 30 adult females in Oklahoma have either been to prison or supervised on probation."
  • When "life" did not mean life A Historical Analysis of Life Sentences Imposed in Michigan Since 1900, [PDF] Citizens Alliance on Prisons & Public Spending. September, 2006. "The historical record makes it indisputably clear that a life sentence in Michigan did not always mean "no release.""
  • Task Force on California Prison Crowding [PDF] National Council on Crime and Delinquency. August, 2006. "Essential services, procedures, and structures designed to reduce recidivism, break the intergenerational cycle of violence, and save taxpayer dollars for more positive expenditures will reduc[e] crime in our communities and enhanc[e] public safety."
  • Recent Trends in New Hampshire's Prison Population [PDF] New Hampshire Center for Public Policy Studies. June, 2006. "Parole revocation is the main factor driving prison admissions, and most revocations are not due to new crimes. In 2002... 66 percent were for technical violations."
  • Prison and Jail Inmates at Midyear 2005 [PDF] Bureau of Justice Statistics. May, 2006.
  • Strengthening Criminal Justice System Practices in Chemung County, NY[PDF] Center for Governmental Research, Inc.. May, 2006. "[A]bout 125 defendants a year are released from jail after 45 days due to lack of timely prosecution. If the jail time for these individuals could be cut in half, almost 8 fewer persons would need to be housed in jail every night."
  • Alabama Sentencing Commission 2006 Report [PDF] Alabama Sentencing Commission. January, 2006. "Of Alabama's inmate population, almost 1 out of 3 inmates are sentenced as an habitual offender."
  • Reducing Racial Disparity While Enhancing Public Safety: Key Findings and Recommendations, [PDF] Council on Crime and Justice. 2006. "The racial disparity in Minnesota's justice system is exceptionally high compared to other states. From arrest to imprisonment, the disparity is over twice the national average."
  • Probation and Parole in the United States, 2004 [PDF] Bureau of Justice Statistics. November, 2005.
  • Prisoners in 2004 [PDF] Bureau of Justice Statistics. October, 2005.
  • Hennepin County Disproportionate Minority Contact Study Examining Extended Jurisdiction Juvenile and Adult Certification Cases, [PDF] Council on Crime and Justice. October, 2005. "[R]ace was not significant when considering the disposition of Extended Jurisdiction Juvenile or Adult Certification motioning. Instead, weapons and firearms appear to be the most influential factor in both motioning and dispositions."
  • Searching for Justice: American Indian Perspectives on Disparities in Minnesota's Criminal Justice System, [PDF] Council on Crime and Justice. August, 2005. "This report indicates that in one county, while American Indians make up only 11.5% of the population, they account for over 50% of the arrest rates."
  • Jails in Indian Country, 2003 [PDF] Bureau of Justice Statistics. April, 2005.
  • Prison and Jail Inmates at Midyear 2004 [PDF] Bureau of Justice Statistics. April, 2005.
  • Tipping Point: Maryland's Overuse of incarceration and the impact on Public Safety, Justice Policy Institute. March, 2005.
  • California Corrections at the Crossroads [PDF] National Council on Crime and Delinquency. March, 2005. "California was once a leader in innovative corrections legislation and programming. However... the last twenty years... have left California with a huge and dysfunctional criminal justice system in woeful need of reform."
  • Adult and Juvenile Correctional Population Projections Fiscal Years 2005-2010, [PDF] Legislative Budget Board. January, 2005. (Texas prison population projections: the adult prison population is projected to increase, while probation population decreases, in juvenile populations both groups projected to grow.)
  • Felony Sentences in State Courts, 2002 [PDF] Bureau of Justice Statistics. December, 2004.
  • Prisoners in 2003 [PDF] Bureau of Justice Statistics. November, 2004.
  • Difficult times in Kentucky corrections: Aftershocks of a "tough on crime" philosophy, Robert G. Lawson. November, 2004.
  • Racial Divide: California's 3 Strikes Law, Justice Policy Institute. October, 2004.
  • No way out Michigan's parole board redefines the meaning of "life", [PDF] Citizens Alliance on Prisons & Public Spending. September, 2004. (When judges imposed a life sentence, they assumed that the prisoner would be parolled in 10-15 years, but in the 1990's the parol board started denying parol, in effect changing the sentence, contributing to overcrowding and increasing costs of prisons.)
  • 3 Strikes & You're Out: An examination of 3-Strike Laws 10 years after their Enactment, Justice Policy Institute. September, 2004.
  • Swing States: Crime, Prisons and the Future of the Nation, Justice Policy Institute. August, 2004.
  • Profile of Jail Inmates, 2002 [PDF] Bureau of Justice Statistics. July, 2004.
  • Probation and Parole in the United States, 2003 [PDF] Bureau of Justice Statistics. July, 2004.
  • The Meaning of Long Prison Sentences in Context, Sentencing Project. May, 2004.
  • Prison and Jail Inmates at Midyear 2003 [PDF] Bureau of Justice Statistics. May, 2004.
  • Still Striking Out: Ten Years of California's Three Strikes, [PDF] Justice Policy Institute. March, 2004.
  • Virginia Criminal Sentencing Commission Annual Report 2003, [PDF] Virginia Criminal Sentencing Commission. March, 2004. (An increasing number of people on probation or parole who have not committed new crimes are being sent to prison for breaking their release conditions)
  • Building Bridges: From Conviction to Employment - One Year Later [PDF] Council of State Governments. February, 2004. (contains detailed maps of high incarceration areas in Hartford and New Haven Connecticut)
  • Options for Policymakers Considering a Justice Reinvestment Initiative in Louisiana, [PDF] Council of State Governments. January, 2004.
  • The high cost of denying parole: an analysis of prisoners eligible for release, [PDF] Citizens Alliance on Prisons & Public Spending. November, 2003. "Although other important factors exist, the single biggest reason for prison growth has been changed parole practices. Far more people who have served their minimum sentences and are, by law, eligible for release, are being denied parole."
  • Jails in Indian Country, 2002 [PDF] Bureau of Justice Statistics. November, 2003.
  • Probation and Parole in the United States, 2002 [PDF] Bureau of Justice Statistics. August, 2003.
  • Prevalence of Imprisonment in the U.S. Population, 1974-2001, [PDF] Bureau of Justice Statistics. August, 2003.
  • Census of State and Federal Correctional Facilities, 2000 [PDF] Bureau of Justice Statistics. August, 2003.
  • New Prison Statistics: Nation's Use of Incarceration On the Rise Again, [PDF] Justice Policy Institute. July, 2003.
  • Prisoners in 2002 [PDF] Bureau of Justice Statistics. July, 2003.
  • U.S. Prison Populations Trends and Implications, [PDF] Sentencing Project. May, 2003.
  • Deep Impact: Quantifying the Effect of Prison Expansion in the South, [PDF] Justice Policy Institute. April, 2003.
  • Texas Tough: 3 Years Later, [PDF] Justice Policy Institute. April, 2003. "After a three-year-decline in the prison population, Texas? prison population may once again be on the rise"
  • Mandatory minimum sentencing is unfair, ineffective, and expensive Common Sense Foundation. April, 2003. (North Carolina)
  • Prison and Jail Inmates at Midyear 2002 [PDF] Bureau of Justice Statistics. April, 2003.
  • The population of women in prison increases rapidly [PDF] Women's Prison Association. March, 2003.
  • Education and Correctional Populations [PDF] Bureau of Justice Statistics. January, 2003. "compares educational attainment of correctional populations to the general population"
  • Building Bridges: From Conviction to Employment A Proposal to Reinvest Corrections Savings in an Employment Initiative, [PDF] Council of State Governments. January, 2003.
  • Probation and Parole in the United States, 2001 [PDF] Bureau of Justice Statistics. August, 2002. (See Trends in State Parole 1990-2000 for more detail and explanations about this potentially misleading report)
  • Prisoners in 2001 [PDF] Bureau of Justice Statistics. July, 2002. "State prison population drops in second half of 2001-Federal inmate growth continues"
  • Analysis of recent Justice Department report: Prisoners in 2001, [PDF] Sentencing Project. July, 2002.
  • Jails in Indian Country, 2001 [PDF] Bureau of Justice Statistics. May, 2002. "At midyear 2001, jails in Indian country supervised 2,030 persons"
  • New Justice Department Study: As Some State Prison Populations Decline, Federal Prison Population Grows, Justice Policy Institute. April, 2002. "While Some State Prison Populations Decline, Federal Lock-up Boom Continues As States Find Alternatives for Nonviolent and Drug Offenders, Federal Imprisonment of Non-Citizens and Drug Offenders Grows"
  • The Influences of Truth-in-Sentencing Reforms on Changes in States' Sentencing Practices and Prison Population, Urban Institute. April, 2002.
  • Prison and Jail Inmates at Midyear 2001 [PDF] Bureau of Justice Statistics. April, 2002.
  • Analysis of new Justice Department report, Prison and Jail Inmates at Midyear 2001, [PDF] Sentencing Project. April, 2002.
  • Criminal Justice and Health and Human Services: An Exploration of Overlapping Needs, Resources, and Interests in Brooklyn Neighborhoods, [PDF] Urban Institute. January, 2002. (by Eric Cadora)
  • Criminal Offender Statistics [Website] Bureau of Justice Statistics. 2002. (Frequently updated with key statistics from their other publications)
  • African American Males in the Criminal Justice System [PDF] Council on Crime and Justice. 2002. "In 2000, 37.2% of the state's prisoners were African American. By comparison only 3.5% of the population of Minnesota was African American."
  • Felony Sentences in State Courts, 1998 [PDF] Bureau of Justice Statistics. October, 2001. "In 1998 federal and state courts convicted 978,211 adults of a felony."
  • A Tale of Two Jurisdictions: Youth Crime and Detention Rates in Maryland & the District of Columbia, [PDF] Building Blocks for Youth. October, 2001.
  • Census of Jails 1999 [PDF] Bureau of Justice Statistics. September, 2001. "At midyear 1999 the Nation's jails held 605,943 inmates, up 32% since the last census in 1993."
  • Prisoner Statistics, 2000 England and Wales [PDF] Home office. August, 2001.
  • Nations' Incarcerated Population Went Up, Not Down, in 1999-2000 Justice Policy Institute. August, 2001.
  • New prison population figures show slowing of growth but uncertain trends[PDF] Sentencing Project. August, 2001.
  • Prisoners in 2000 [PDF] Bureau of Justice Statistics. August, 2001.
  • Aging Behind Bars: Three Strikes, Seven Years Later, [PDF] Sentencing Project. August, 2001.
  • U.S. continues to be world leader in rate of incarceration [PDF] Sentencing Project. August, 2001.
  • Probation and Parole in the United States, 2000 [PDF] Bureau of Justice Statistics. August, 2001. "National correctional population reaches new high -- Grows by 117,400 during 2000 to total 6.5 million adults"
  • Jails in Indian Country, 2000 [PDF] Bureau of Justice Statistics. July, 2001.
  • Off Balance: Youth, Race & Crime in the News Building Blocks for Youth. April, 2001.
  • Analysis of BJS June 30, 2000 statistics [PDF] Sentencing Project. March, 2001.
  • Prison and Jail Inmates at Midyear 2000 [PDF] Bureau of Justice Statistics. March, 2001.
  • Too Little Too Late: President Clinton's Prison Legacy, [PDF] Justice Policy Institute. February, 2001.
  • The Expanding Federal Prison Population [PDF] Sentencing Project. 2001.
  • Responsibility, Rehabilitation, and Restoration: A Catholic Perspective on Crime and Criminal Justice, [PDF] Catholic Bishops of the United States. November, 2000.
  • Correctional Populations in the United States, 1997 [PDF] Bureau of Justice Statistics. November, 2000.
  • Texas Tough? An Analysis of Incarceration and Crime Trends in The Lone Star State, Justice Policy Institute. October, 2000.
  • Diminishing Returns: Crime and Incarceration in the 1990s, [PDF] Sentencing Project. September, 2000.
  • The Punishing Decade: Prison and Jail Estimates at the Millennium, [PDF] Justice Policy Institute. May, 2000.
  • State and Federal Prisoners: Profiles of Inmate Characteristics in 1991 and 1997, [PDF] General Accounting Office. May, 2000.
  • Veterans in Prison and Jail [PDF] Bureau of Justice Statistics. January, 2000. "Male military veterans are incarcerated at less than half the rate of non-veterans"
  • Shattering "Broken Windows": An Analysis of San Francisco's Alternative Crime Policies, [PDF] Justice Policy Institute. October, 1999.
  • Felony Sentences in the United States, 1996 [PDF] Bureau of Justice Statistics. July, 1999.
  • Time Served in Prison by Federal Offenders, 1986-97 [PDF] Bureau of Justice Statistics. June, 1999. "Describes changes in sentences imposed and time served brought about by the Sentencing Reform Act of 1984"
  • Prior Abuse Reported by Inmates and Probationers [PDF] Bureau of Justice Statistics. April, 1999.
  • Striking Out: The Failure of California's, [PDF] Justice Policy Institute. March, 1999.
  • America's One Million Nonviolent Prisoners Justice Policy Institute. March, 1999.
  • Half Truths: The Complicated Story of D.C.'s Halfway House, Justice Policy Institute. March, 1999.
  • Truth in Sentencing in State Prisons [PDF] Bureau of Justice Statistics. January, 1999. "State sentencing law changes linked to increasing time served in State prisons"
  • Federal Offenders under Community Supervision, 1987-96 [PDF] Bureau of Justice Statistics. August, 1998.
  • Profile of Jail Inmates, 1996 [PDF] Bureau of Justice Statistics. April, 1998.
  • Three strikes: 5 years later [PDF] Sentencing Project. 1998.
  • Characteristics of Adults on Probation, 1995 [PDF] Bureau of Justice Statistics. December, 1997.
  • Did Getting Tough on Crime Pay? Urban Institute. August, 1997.
  • Census of State and Federal Correctional Facilities, 1995 [PDF] Bureau of Justice Statistics. August, 1997.
  • Lifetime Likelihood of Going to State or Federal Prison [PDF] Bureau of Justice Statistics. March, 1997.
  • Criminal Justice in Massachusetts: Putting Crime Control First, BOTEC Analysis Corporation of Cambridge. October, 1996. "Opportunities to reduce crime are systematically neglected, as policy making is dominated by the need to appease the public's justifiable fear and anger and by a wide variety of organizational and professional interests and ideological postures."
  • Prison and Jail Inmates, 1995 [PDF] Bureau of Justice Statistics. August, 1996.
  • Noncitizens in the Federal Criminal Justice System, 1984-94 [PDF] Bureau of Justice Statistics. August, 1996.
  • Prisoners at Midyear 1995 [PDF] Bureau of Justice Statistics. December, 1995.
  • Probation and Parole Violators in State Prison, 1991 [PDF] Bureau of Justice Statistics. August, 1995.
  • Jails and Jail Inmates, 1993-94 [PDF] Bureau of Justice Statistics. April, 1995.
  • Prison Sentences and Time Served for Violence [PDF] Bureau of Justice Statistics. April, 1995.
  • Continuing Crime of Black Imprisonment Committee to End the Marion Lockdown. 1995.
  • Three Strikes and You're Out: Estimated Benefits and Costs of California's New Mandatory-Sentencing Law, RAND Foundation. 1994.
  • Survey of State Prison Inmates, 1991 [PDF] Bureau of Justice Statistics. March, 1993.

Pages Updated On: 10-Nov-2011 - 12:09:18